 |
| Reviews and Templates for Expression We |
How to Capture Meaningful Climate Data to Boost Building Performance

A key requirement of buildings is to provide a sheltered living and
working space from the extremes of climate. That's coupled with the
objective of environmental building design, which is to create of a
comfortable yet energy efficient internal environment.
That being
said, the successful design of comfortable buildings relies on an
appropriate understanding of climate. In practice, however, it is
difficult to translate climate data into meaningful information that can
capture local climate characteristics.
There have been several
attempts to establish a relationship between comfort, climate and built
form, and to explore various climatic design strategies. However, these
approaches are limited in many ways, such as to certain building types or
climate types, and they require a high level of interpretation to be
correctly used in the design process.
So what can enable climate
to be used as a simpler and more transparent benchmark for procedures
such as LEED? In 2004, a methodology was defined to enable just that,
resulting in the derivation of two globally-applicable energy indices:
the Climate Energy Index and the Building Energy Index.
Energy Indices to the Rescue
The CEI and BEI can be used
to assess, clarify and compare any worldwide climate data and hence
quantify the climate impact on building energy performance. Specifically,
the CEI provides an indication of the consequence of climate with respect
to building performance at an accepted standard of comfort at a
particular geographic location. It can be calculated for all hours or
hours of use for a particular building. Based on a unitary air-flow, it
operates only on the air point and there is no inclusion for building
thermal process. In contrast, the BEI is an overall performance indicator
for building design strategy. It comprises the climate-related and
climate-unrelated energy loads, which are respectively derived from the
CEI and benchmark data for non-space conditioning energy uses. The BEI
can be compared directly with simulated or measured energy consumption
data of a proposed building to benchmark its energy performance.
Calculating the CEI
The fundamental premise of
the CEI is that people require a reasonably consistent degree of comfort,
and the energy required to achieve that comfort can be used to quantify
the climatic impact on a building by outside air. The CEI calculates the
energy required to condition any weather hourly ordinate to the nearest
boundary of a human comfort zone. Derived from existing comfort ranges
including ASHRAE Standard 55, the human comfort zone shown in Figure 1
provides a reasonable representation of good human comfort on a global
scale.
Figure 1. Human comfort zone of the climate energy index.
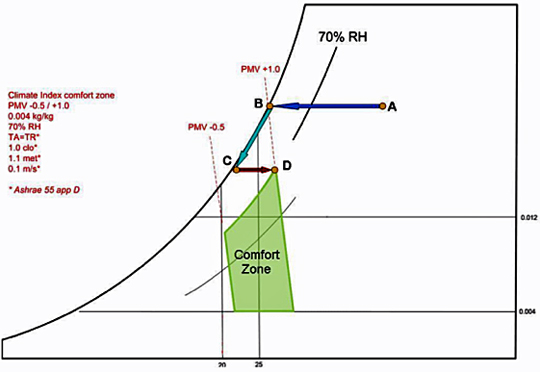
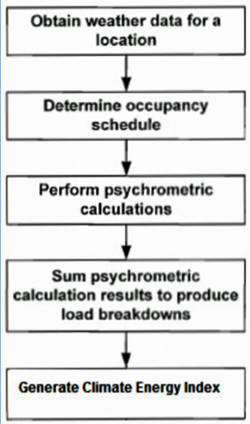
Figure 2 shows a flow diagram for calculating the CEI. First, weather
data needs to be selected, which can include air point information such
as air temperature and moisture content. An occupancy schedule also needs
to be specified which indicates the level of occupancy in a building. The
CEI can be calculated for all 8,760 hours of the year to consider the
effect of the weather data when conducting the CEI calculation, or it can
be calculated only for hours of building operation.
Figure 2. Flow
diagram of calculating Climate Energy Index.
For each hour under consideration, a psychrometric calculation can then be performed. This calculation provides an indication of the amount of energy required to bring or move an outside air point to a point on the boundary of the defined human comfort zone. It can be conducted for each energy load type used to reach the desired comfort point, such as cooling energy, heating energy, humidification energy and dehumidification energy.
For example, a summer weather ordinate is located at point A in Figure 1. To determine the amount of energy required to move from point A to the nearest boundary in the comfort zone, three steps can be taken. It starts from point A to point B, which requires a certain amount of sensible cooling energy, then from point B to point C, which demands a certain amount of cooling and dehumidification energy, and lastly from point C to point D, which requires a certain amount of sensible heating energy. Once the amount of energy required for each energy load type is determined for a particular weather file hourly ordinate, a similar calculation can be performed on the remaining weather file hourly ordinates. The totals for each energy load type can be added and then used to determine the CEI, which is the sum of the annual totals of all the energy load types. The unit of the CEI is kWh/yr per m3/hr.
Calculating the BEI
Climate is the basic determinant for the design and operation of buildings. The BEI can be used as an overall performance indicator for building design strategy. It comprises the climate-related and climate-unrelated energy loads, which are respectively derived from the CEI and benchmark data for non-space conditioning energy uses.
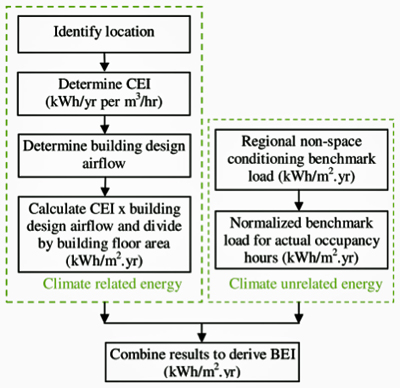
Figure 3 illustrates the calculation procedure of the BEI. The
climate-related energy part in the BEI is calculated as follows:
1. Determine the CEI of the location for building design
hours.
2. Specify the building design airflow; a sum
of infiltration and ventilation airflow.
3. Multiply
the CEI by building design airflow divided by the floor area.
The
climate-unrelated energy part is calculated based on the non-space
conditioning benchmark load data, such as hot water load, equipment load,
lighting load and process load. The non-space conditioning benchmark data
can be normalized to reflect the same occupancy hours as the specific
building being assessed so that the BEI can be directly compared to the
simulated building or measured data.
Figure 3. Flow diagram of calculating Building Energy Index.
Implementing the Energy Indices
The CEI and BEI have been implemented into dynamic thermal simulation software, enabling calculations of the indices to be accomplished quickly and effectively. All of the inputs required for generating the CEI are simply weather data of a particular location and building hours of use. Since the BEI is in conjunction with the CEI, the weather data and hours in use are also required for calculating the BEI along with the information of building design air exchange rates, floor area and building type. The building type determines the default benchmark figures of non-space conditioning loads. Calculation results of the CEI and BEI can then be easily compared with simulated energy consumption data of a proposed building to benchmark its energy performance. The energy performance of the proposed building can be dynamically simulated in parallel by other integrated thermal modules within the software.
Case Study
To provide a worldwide perspective of building energy use resulted from the climate impact, 14 global locations were selected to calculate the CEI values, including Miami, Boston, London, Sydney and Singapore. These locations represent the most common climate types, from cold climate, temperate climate to hot and humid climate. Calculations were conducted based on 24-hour use.
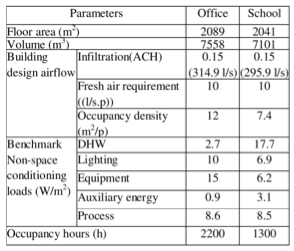
Two types of building models, a school and an office building, were chosen to calculate the BEI values based on the 14 locations. The main data information required for the calculations, such as floor area, volume, building design airflow and non-space conditioning benchmark loads are shown in Table 1.
CEI Calculation Results
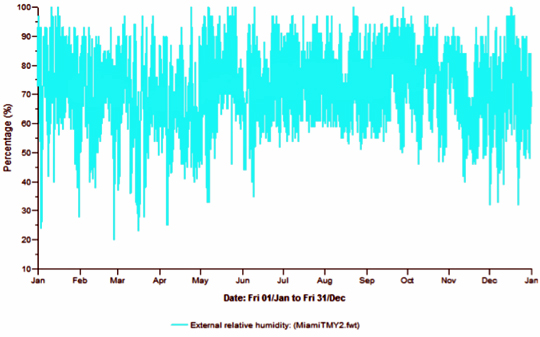
Figure 4 presents the CEI's monthly breakdown by energy load type for Miami based on 24-hour use. The annual CEI for Miami was calculated to be 36.46 kWh/yr per m3/hr. As indicated in Figures 5 and 6, which show hourly dry-bulb air temperature and relative humidity of Miami over a year respectively, Miami has a warm, humid climate with hot, humid summers and short, warm winters. The relative humidity is mostly around 60-95% over the year and the air temperature is generally between 18-32oC. It is therefore not surprising to see from Figure 4 that both sensible cooling and dehumidification are distributed over the 12 month. The red and blue curved lines shown in Figure 4 represent trend lines for the monthly energy totals, helping to quickly understand the basic pattern of the heating and cooling loads.
Figure 4. Monthly CEI breakdown for Miami based on 24-hour use.
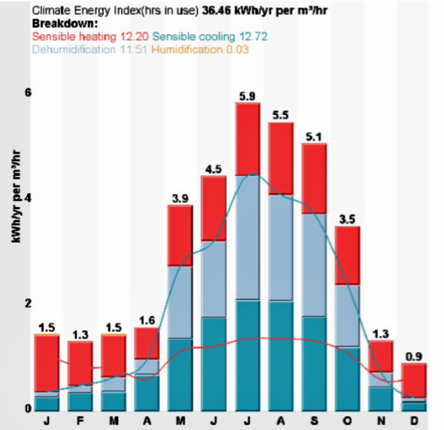
Figure 5. Hourly dry-bulb temperatures of Miami over a year.
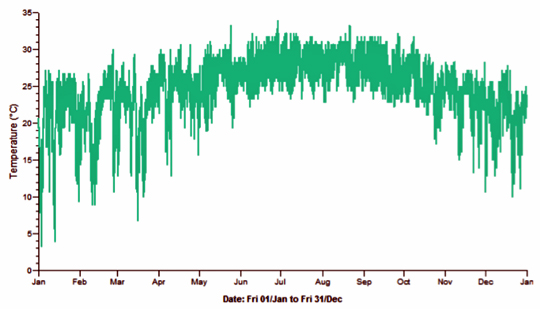
Figure 6. Hourly relative humidity of Miami over a year.
All energy loads predicted by the CEI for a particular location depend solely on the climate data and hours of use of a building. Therefore, the CEI can be used as an indicator to help architects and engineers understand what type of energy loads might be involved and what time of a year they might be required, even before considering the building form, construction and HVAC system. It provides a clear intuitive understanding of basic building energy use with respect to climate impact, allowing building design strategies to be explored at the very early design stage.
Figure 7 shows CEI variations with a detailed breakdown by energy load type for the selected 14 locations based on 24-hour use. Table 2 lists the corresponding values for 24-hour use. The CEI and energy load type breakdown vary significantly by locations.
Figure 7. CEI variation for 14 worldwide locations based on 24-hour use.
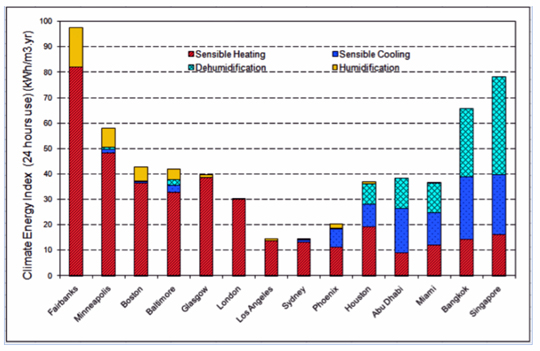
Table 2. CEI based on 24-hour use for selected representative locations.v xmxmx
BEI Calculation Results
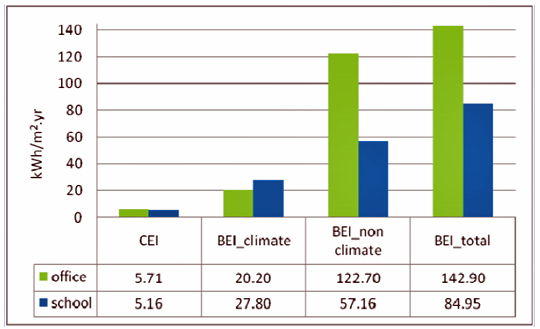
Figure 8 shows the CEI and BEI values of the school and the office building models together with energy breakdown of the BEI by climate-related and climate-unrelated load based on London weather data. As expected, the CEI values for both building models are very similar. Owing to the longer occupancy period used in the office model as shown in Table 1, the CEI value for the office building is slightly higher. As displayed in Figure 8, the climate-related energy loads of the BEI for both building models are similar, too. However, the climate-based energy component for the office building is lower than that of the school building, as the office building model has an overall smaller ratio of the building design airflow to the floor area. In addition, the climate-unrelated energy loads of the BEI are considerably high in the office building. This is caused by the large load from the non-space conditioning energy use. As a result, the BEI is predicted to be 142.9kWh/m2.yr for the office building and 84.95kWh/m2.yr for the school building.
Figure 8. CEI and BEI values of two building models based on London climate.
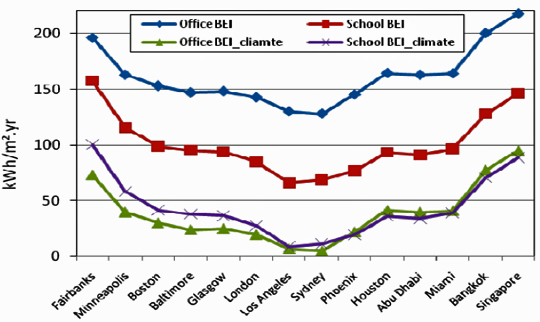
Variation of the BEI and its climate-related energy component for both building models are plotted in Figure 9 against the 14 global locations. Consistent with the findings in Figure 8, the climate-related energy loads of the office building model stay close to those of the school building model with the change in climatic conditions. Figure 9 also indicates the sensitivity of the climate-related energy load to the different climate types. As can be seen, the climate-related energy load is much higher in the extreme climate, such as dry and cold climate or hot and humid climate, than that in the mild climate.
Figure 9 Variation of the BEI and its climate-related energy component for both building models.
Enabling Truly Sustainable Design
The CEI and BEI were developed to help quantify the climate impact on building energy performance and distinguish climate-related and climate-unrelated energy end uses in a simple way. When implemented into dynamic thermal simulation software, these indices provide architects and engineers with a common basis for comparing building energy performance and different design strategies – enabling the development of sustainable, low-energy buildings from the very earliest stages of the design process.
|
|
|
|
Copyright 2011 Energy and Technical Services Ltd. All Rights Reserved. Energyts.com |