Want to understand why we're not solving climate change? Then follow the money – which in this case means following the carbon. I've spent much of the past 24 hours crunching data and it turns out there's a very striking – and oddly overlooked – correlation between fossil fuel reserves and national negotiating position on climate change.
First, though, some background. Last year I wrote about the emerging concept of a "carbon bubble" and the risks for investors of putting money into companies that hold fossil fuel reserves. After all, if the world is to meet its stated 2C target for limiting global warming, most of those fuels will need to be left in the ground.
Months later, during the Durban climate talks, I found myself wondering how all that unburnable fuel was distributed globally – and how this might be affecting the negotiations. When I finally got around to looking, I was surprised that there didn't seem to be a good dataset of the potential emissions of each country's fossil fuel reserves. So I decided to make my own. I took the fossil fuel data from most recent BP Statistical Review of World Energy and converted the oil, coal and gas reserves listed for each country into the approximate amount of CO2 that would be released if they were burned.
I should emphasise that the resulting dataset – which I've made available here – is rough and ready. It required a lot of manual data manipulation, so I can't promise that it's error-free. And the underlying BP data is limited in various ways – for example, it just lists "coal" (rather than different types of coal) and the figures for tar sands (which are listed only for Canada) seem oddly low. I hope to work with the Carbon Tracker Initiative to publish a more authoritative dataset in due course, but for now I think this one is sufficient to illustrate the point. Do tweet me on @theduncanclark with any comments or corrections.
Next I annotated the data to highlight countries and regions that have featured prominently – positively or negatively – in the climate negotiations in the last year or two. Of course, all of this is very subjective. Countries don't have simple 'yes' and 'no' stances on whether we should sign a global deal, and all of them would describe their own position as fair and constructive. To make things more complex many individual nations are members or one or more negotiating blocs, each of which contains a range of perspectives. (I'm grateful to UNFCCC delegate Mark Lynas for talking me through this complex web of associations and positions.)
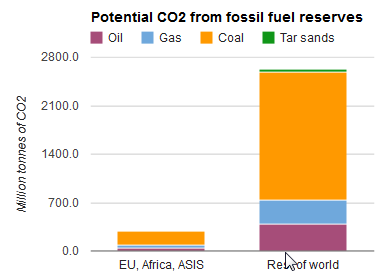
Those complexities notwithstanding, we can paint a broad-brush picture. For example, it was widely reported during the Durban talks that the key push for an ambitious deal was coming from an informal alliance of the EU, Africa and ASIS (the Alliance of Small Island States). I found myself wondering what proportion of the world's 'carbon reserves' these nations hold. Answer: not much. As the graph below shows, the regions pushing hardest for a global deal are home to only a tenth of the potential CO2 locked up in the world's remaining fossil fuel reserves.

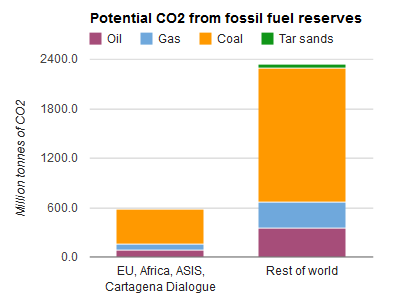
Of course, the true picture is more nuanced as various other nations have been credited with working proactively towards a global deal. In the run-up to Durban, these progressive nations joined together to form an informal alliance called the Cartagena Dialogue. As far as I can tell, there's no formal membership list, but in addition to the EU, some African states and ASIS, the Cartagena group has included a handful of nations each from Asia (Indonesia, Bangladesh, Thailand), Latin America (Colombia, Peru, Mexico) and Oceania (Australia, New Zealand), plus a lone representative of the Middle East (UAE).
Not all these nations necessarily delivered on the ground. For example, Australia – despite having recently pushed through a carbon tax at home – didn't play a very prominent role in Durban and, according to one observer, appeared to be principally concerned with helping the US. But let's be generous, ignore these caveats and add all of these Cartagena Dialogue nations to the 'yes' stack. Surprisingly, we still only get to 20% of global carbon reserves – or less than 14% if we decided to leave off Australia.

So what happens if we spin the picture around and look at the countries widely perceived to be actively unhelpful in the negotiations. Again, this is by no means an exact science, so let's just pick a handful of prominent countries: the US, China, India, Saudi Arabia, Canada and Russia. If my data is correct, these six nations contain almost 60% of the world's potential fossil-fuel CO2.


