 |
| Reviews and Templates for Expression We |
How to Get the Most from Monitoring Building Energy Use

Not all energy is created equal. But it goes far beyond the renewable-vs-non-renewable sense that so many already consider.
There are really three kinds of energy:
- Energy required for site activity, i.e. the purpose for which a business is in business;
- Energy required for the maintenance of the building, 24-7, regardless of activity, and which makes up the baseline energy use -- emergency lighting, stand-by water heaters; and
- Heating and cooling to keep the buildings at a comfortable temperature.
You can also think of these energies in the context of dependence, for which there are also three categories: Energy is:
- dependent on business activity,
- dependent on nothing (i.e. it's constant), and
- dependent on weather (and insulation levels . . . and occupancy levels, potentially)
When we look for patterns in energy use, these different energy types become very relevant. If you're trying to figure out what might be causing excessive energy use, you need to be able to isolate potential causes -- whether it's occupant activity, weather changes, or something else. Ideally, you would have these three energies metered differently.
For example, if all you have is the total energy use on one meter for a site, in the case of energy-intensive industries or facilities, you won't be able to see any weather variations, since any weather-related energy use will be dwarfed by energy use in normal site activity.
But when you do have these energies isolated by meter, or when your building is dominated by one type of energy, you can then normalize energy use with what's driving energy use: You can compare activity energy use to the level of activity, compare weather-based energy use to weather, and so on. And then you can see whether there's a correlation.
If energy doesn't correlate with its driver, you know you've got a problem.
Once you find this correlation with the past, you then have the power to predict the future. You can forecast how much energy a given level of activity should require, and you can forecast how much heating and cooling should be required based on temperature.
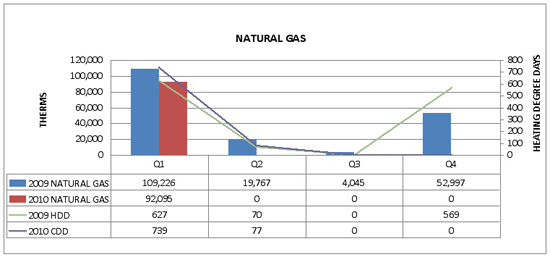
Further, when you find differences between what you ended up using, and what you had forecast, you then identify potential problems. Or, if you had implemented efficiency improvements, you can see that difference as a quantification of how much you (hopefully) saved. For example, looking at some data, here we see a comparison of natural gas use with the expected natural gas demand (heating degree days). In general, gas use is tracking the number of degree days; in fact, 2009 shows a fairly high correlation.
In our 2010 Q1 data, we see that additional investigation is required -- heating degrees went up, but gas use actually went down. This could be due to better efficiency, better management practices, or the influence of other factors (increased downtime, decreased occupancy, etc.)

To analyze data, look for trends, and see patterns is obviously a useful skill to develop and a beneficial habit to get into. Whether you're seeking to improve your business energy efficiency, or are working farther afield, like using biomimicry principles to inform product design. It lies at the core of using information to generate insight.
|
|
|
|
Copyright 2011 Energy and Technical Services Ltd. All Rights Reserved. Energyts.com |