 |
| Reviews and Templates for Expression We |
New Zealand's Greenhouse Gas Inventory 1990–2011 and Net Position
Snapshot April 2013
Key points:
In 2011, New Zealand's total greenhouse gas emissions were 72.8 million tonnes of carbon dioxide equivalent (Mt CO2-e), which means total emissions are now 13.2 Mt CO2-e (22.1 per cent) higher than the 1990 level of 59.6 Mt CO2-e.
In 2011, the net amount of carbon dioxide removed from the atmosphere (net removals) due to afforestation, reforestation and deforestation under the Kyoto Protocol was 16.8 Mt CO2-e.
Agriculture was the largest contributor to New Zealand's emissions in 2011 (47.2 per cent) closely followed by the energy sector (42.6 per cent).
New Zealand's net emissions are less than the average annual assigned amount units for the first commitment period (2008–2012). We are on track to meet our Kyoto Protocol target for the first commitment period.
This snapshot presents commonly asked questions about New Zealand's emissions and provides answers from New Zealand's Greenhouse Gas Inventory 1990–2011 released on 12 April 2013.
The inventory is the official annual report of all human-caused emissions of greenhouse gases in New Zealand. The complete inventory submission is available on the Ministry for the Environment's website at www.mfe.govt.nz/publications/climate/.
The timing of reporting is based on guidelines under the United Nations Framework Convention on Climate Change (UNFCCC). Each inventory report is submitted 15 months after the end of the calendar year, providing time for the data to be collected and analysed.
How much does each sector contribute to total emissions?
In the inventory, emissions are categorised into six different sectors:
- energy (eg, road transport and electricity production)
- industrial processes (eg, metals, minerals and chemicals)
- solvent and other product use
- agriculture (eg, agricultural soils, enteric fermentation and manure management)
- land use, land-use change and forestry (LULUCF)
- waste.
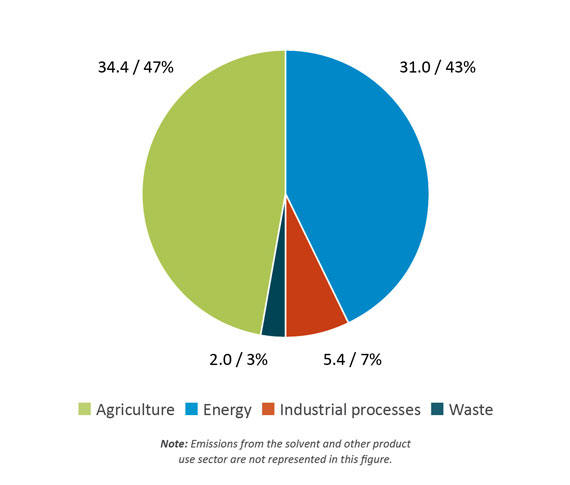
Agriculture was the largest contributing sector to New Zealand's emissions in 2011. It contributed 34.4 million tonnes of carbon dioxide equivalent (Mt CO2-e), and comprised 47.2 per cent of total emissions (figure 1). Energy was the second largest sector, contributing 31.0 Mt CO2-e, 42.6 per cent of total emissions.
Industrial processes, waste, and solvents and other products are smaller sectors, contributing 5.4, 2.0 and 0.03 Mt CO2-e respectively (making up 7.5 per cent, 2.7 per cent and 0.04 per cent of total emissions respectively).
Figure 1: New Zealand's greenhouse gas emissions (by sector, in million tonnes of CO2 equivalent) in 2011
Read a description of this image
Note: Emissions from the solvent and other product use sector are not represented in this figure.
Why have New Zealand's total emissions increased since 1990?
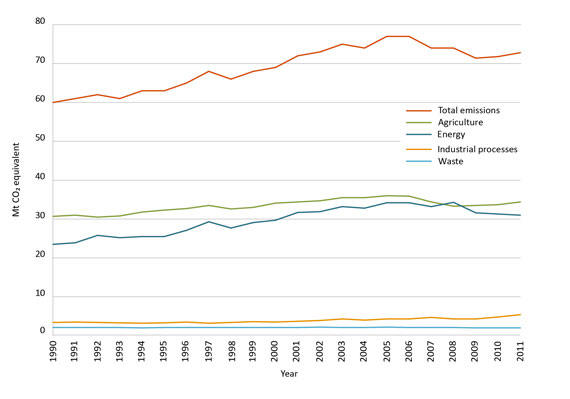
In 1990, New Zealand's total emissions were 59.6 Mt CO2-e. In 2011, this total had increased by 13.2 Mt CO2-e (22.1 per cent) to 72.8 Mt CO2-e. The four sources that contributed the most to this increase in total emissions were emissions from dairy cattle, road transport, agricultural soils and release of hydrofluorocarbons (HFCs) from industrial and household refrigerant and air-conditioning systems. Figure 2 shows the changes in emissions by sector from 1990 to 2011.
New Zealand's total emissions peaked in 2005, decreased from 2006 to 2009, and show an increasing trend from 2009 to 2011.
Although agriculture was New Zealand's largest emitting sector in 2011, since 1990 energy emissions have increased over twice as much as those from agriculture. Consequently, the proportion of energy emissions as part of total emissions has increased over time. Energy and agricultural emissions now occupy similar proportions.
The decrease in agricultural emissions between 2006 and 2008 was caused by a reduction in sheep, non-dairy cattle and deer populations due to widespread drought. The drought also reduced livestock productivity. Since 2008, agricultural emissions have been increasing due to more favourable growing conditions, as well as greater demand for New Zealand agricultural produce in the dairy sector.
There are a number of reasons for the decrease in energy emissions since 2008. These include:
- a reduction in the use of coal (gas replaced coal due to the commissioning of a combined cycle gas turbine at the Huntly Power Station) and an increase in the use of renewable electricity generation (geothermal, wind and hydro-electric)
- a decrease in electricity demand after the Canterbury earthquake in 2011
- a decrease in road transport emissions between 2008 and 2009 due to the economic downturn
- a decrease in the release of methane emissions from coal mining activities from 2010 to 2011. This was a result of the sealing of the Pike River mine following an explosion and the suspension of coal production at Spring Creek mine on the West Coast of the South Island.
Emissions from industrial processes have increased since 2009 due to the continued increase in the release of HFCs from industrial and household refrigerant and air-conditioning systems. This increase is due to their use as a substitute for chlorofluorocarbons phased out under the Montreal Protocol.
Figure 2: New Zealand's total greenhouse gas emissions from 1990 to 2011
Read a description of this image
How much carbon is removed from the atmosphere by New Zealand's forests?
A carbon sink is a natural or human-made reservoir that removes and stores more carbon than it releases. Forests act as a carbon sink as they grow by absorbing carbon dioxide from the atmosphere and storing it in their trunks, branches, leaves and roots.
A key factor affecting the rate at which a forest absorbs and stores CO2 from the atmosphere is its age. A newly planted forest is slow at removing CO2, but once established it will enter a period of rapid growth during which it will absorb the most CO2. Once a forest has reached maturity, its growth slows and the rate at which it absorbs CO2 decreases.
When forests are harvested they switch from being a carbon sink to a carbon source, releasing carbon into the atmosphere rather than removing it. The speed at which the stored carbon is released from the harvested wood is hard to predict, as it depends on the type of product that the wood is transformed into. Under the first commitment period of the Kyoto Protocol (2008–2012) it is assumed that all the carbon stored in wood is emitted at time of harvest. Consequently, planting and harvesting cycles have a large impact on the amount of CO2 removed by our forests.
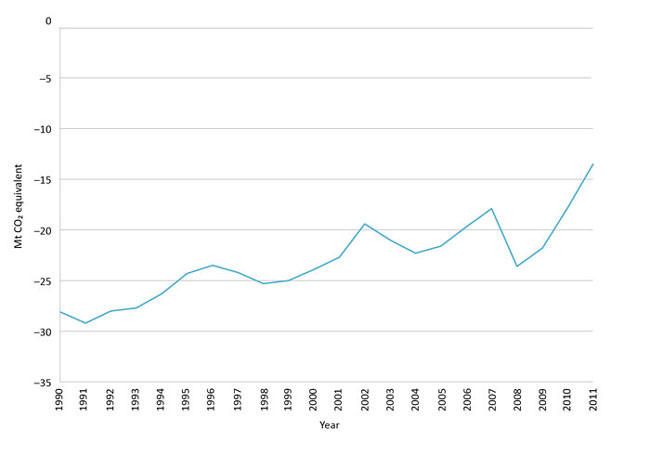
Net removals of CO2 from New Zealand's forests have fluctuated over the period 1990–2011 (figure 3). This is due to tree growth, harvesting and changes in the forest area. In 2011, under UNFCCC reporting, New Zealand's net removals from land use, land-use change and forestry (LULUCF) were 13.5 Mt CO2-e.Footnote 1 This estimate is different to the 2011 estimate of 16.8 Mt CO2-e for net removals from afforestation, reforestation and deforestation reported under Article 3.3 of the Kyoto Protocol (see Definitions). This is because under Article 3.3 of the Kyoto Protocol, New Zealand can only account for removals from forests established after 31 December 1989.
Definitions
Afforestation
The establishment of a forest in an area where there was no forest for at least 50 years.
Reforestation
The re-establishment of a forest in an area where forest has previously been converted to other land uses during the past 50 years. For the first commitment period, reforestation is limited to areas that were non-forest on 31 December 1989.
Deforestation
The removal of a forest from an area which is then converted to a non-forest use (eg, dairy farm).
Figure 3: Net removals from land use, land-use change and forestry (under the UNFCCC) Footnote 2
Read a description of this image
What influences the area of forest?
The area of a forest has historically been influenced by government policy, returns from forestry and the relative returns compared to other land uses.
New Zealand's planted forest area increased significantly between 1992 and 1998. This followed a change in the taxation regime, an unprecedented price spike for forest products with subsequent favourable publicity, a government focus on forestry as an instrument for regional development, and the conclusion of the state forest assets sale.Footnote 3 The removal of agricultural subsidies in New Zealand and generally poor performance of the New Zealand and international share markets also encouraged investors to seek alternatives during this time.
Between 2004 and 2008, the area of New Zealand's forests decreased due to an increase in deforestation of planted forests before the introduction of the New Zealand Emissions Trading Scheme (NZ ETS). The decrease in net removals observed since 2008 is largely due to increased harvesting levels in pre-1990 planted forests as a larger proportion of the estate reaches harvest age. In 2011, deforestation emissions were 1.7 Mt CO2-e, primarily driven by the relative profitability of forestry compared with alternative land uses.
The area of new planting has slowly increased since 2007. The contributing factors are the NZ ETS, Permanent Forest Sinks Initiative, Hill Country Erosion Fund and Afforestation Grant Scheme which were introduced by the New Zealand Government to encourage new planting and the regeneration of natural forest.
What are New Zealand's net emissions for 2011?
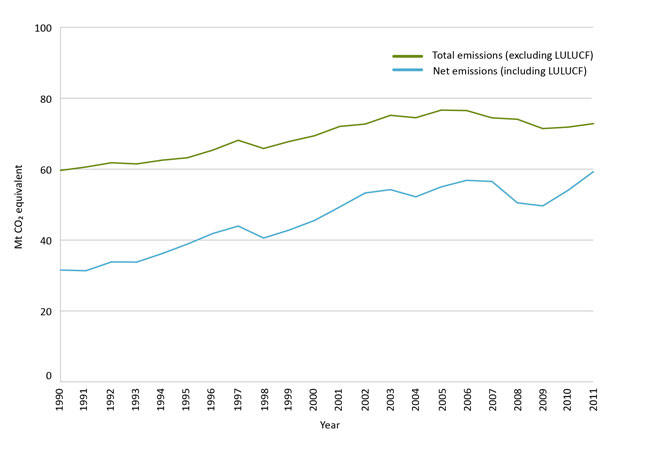
In 1990, New Zealand's net greenhouse gas emissions under the UNFCCC were 31.5 Mt CO2-e. In 2011, net greenhouse gas emissions had increased by 27.8 Mt CO2-e (88.1 per cent) to 59.3 Mt CO2-e. For details on net emissions under the Kyoto Protocol, see page Definitions below.
Figure 4: New Zealand's total and net emissions (under the UNFCCC) from 1990 to 2011
Read a description of this image
Definitions
Total emissions reported under the UNFCCC and under the Kyoto Protocol come from the following sectors: agriculture, energy, industrial processes, waste, and solvent and other product use.
Net emissions under the UNFCCC are total emissions plus emissions and removals from land use, land-use change and forestry (LULUCF).
Net emissions under the Kyoto Protocol are total emissions plus emissions and removals from activities under Article 3.3 of the Kyoto Protocol (afforestation, reforestation and deforestation since 31 December 1989).
The main difference between the two definitions of net emissions is that reporting under Article 3.3 of the Kyoto Protocol excludes removals and harvesting emissions from forests established before 1990. This 1990 baseline is a reference against which to measure progress, allowing for comparison between countries and between sectors.
How and why have New Zealand's emissions changed between 2010 and 2011?
Between 2010 and 2011:
- There was an increase in total emissions of 1.0 Mt CO2-e (1.4 per cent).
- Emissions from the energy sector decreased by 0.3 Mt CO2-e (1.0 per cent). This was due to a reduction in electricity demand after the Canterbury earthquake and an increase in the supply of wind-generated electricity following the commissioning of two new wind farms. It was also due to a decrease in the release of methane emissions from coal mining activities following the closure of the Pike River mine and suspension of coal production at Spring Creek mine on the West Coast of the South Island.
- Emissions from industrial processes increased by 0.7 Mt CO2-e (14.0 per cent). This was mainly due to a large amount of hydrofluorocarbons being imported into the country in 2011 compared to previous years.
- Agricultural emissions increased by 0.7 Mt CO2-e (2.0 per cent). Due to favourable weather and milk prices there was an increase in the dairy cattle population. There was also an increase in the use of nitrogen containing fertiliser.
- Net removals from land use, land-use change and forestry (LULUCF) decreased by 4.3 Mt CO2-e (24.0 per cent). This was largely due to a greater proportion of forest being harvested as more of New Zealand's planted forests reached harvest age in 2011. There were also increased emissions in grassland due to larger areas of forest being converted to grassland.
How do New Zealand's emissions compare to other countries?
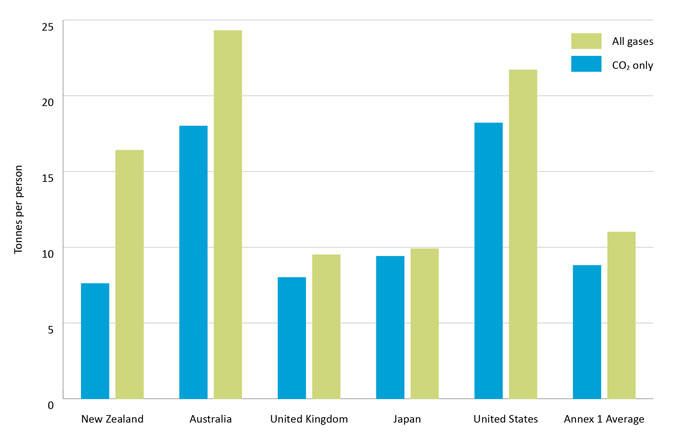
New Zealand's emissions are low compared to our major trading partners. In 2010, New Zealand's total emissions were 71.7 Mt CO2-e,Footnote 4 approximately 0.14 per cent of total world emissions.Footnote 5 However, New Zealand's emissions intensity by population is high. In 2010, New Zealand's emissions per person were fifth highest among 40 Annex 1 countries,Footnote6 at 16.4 tonnes CO2-e per person (figure 5).Footnote 7
New Zealand's emissions profile is unusual among developed countries. For many developed countries, the agricultural sector contributes only a small part of their emissions, on average around 12 per cent. Furthermore, CO2 makes up about 80 per cent of most developed countries' emissions.Footnote 7 Due to the high level of agricultural production in New Zealand, most of it for export, our emissions profile is quite different. In New Zealand agricultural methane and nitrous oxide comprise almost half of total emissions (52 per cent in 2011) and CO2 comprises a similar proportion (46 per cent in 2011).
When considering atmospheric concentrations of greenhouse gases, reducing agricultural emissions from methane and nitrous oxide is important but CO2 presents a greater challenge in the long term because it persists in the atmosphere for thousands of years. Agricultural gases have a strong warming effect in the short term, but do not persist in the atmosphere. If New Zealand is compared to other countries on a CO2-only basis, our emissions are 22nd highest among Annex 1 countries, at 7.6 tonnes CO2 per person (figure 5).Footnote 7 New Zealand's lower CO2 emissions per person reflect the high proportion of renewable generation in the electricity sector.
Figure 5: International comparisons for per capita emissions in 2010, CO 2 and all gases Footnote 7
Read a description of this image
How has the accuracy of estimates improved?
The continuous improvement of inventory development and reporting is an underpinning principle of the UNFCCC reporting requirements. Greenhouse gas inventories are examined each year by a team of international expert reviewers, who critique the report against internationally agreed guidelines and recommend areas for improvement.
Inventory improvements may include recalculated emission estimates. These recalculations can arise from improvements in activity data, emission factors and methodology, or when additional emission sources are identified. It is international good practice to recalculate the entire time-series from 1990 (base year) to the latest inventory year (2011) to ensure emission trends do not reflect methodological influence. This means emissions reported in previous inventories may differ from those reported in this year's inventory.
Since the last inventory submission, improvements have been made to the accuracy of the emission estimates. The most significant improvements in this year's inventory were in the forestry and energy sectors as described below:
Forest land
- The activity data used to estimate harvesting emissions in pre-1990 planted forests has been scaled by 17 per cent throughout the time-series. This scaling is required to align the harvest activity data with the pre-1990 forests area as each is derived on the basis of different forest definitions.
- A discrepancy which affected the implementation of the new post-1989 planted forest yield table has now been corrected.
- Mapping data from the NZ ETS was integrated into the 1990 and 2008 maps, improving the accuracy and consistency of the mapping of pre-1990 planted forest and post-1989 forest.
- Emissions from controlled burning in forest land remaining as forest land have been reported for the first time in the 2013 submission. Estimates are provided for the burning of post-harvest residue prior to restocking.
Energy
- The carbon dioxide emission factors for solid fuels were reviewed and updated. This has resulted in changes in emissions from solid fuel combustion across all sectors, including public electricity and heat production.
The complete inventory submission is available on the Ministry for the Environment's website at: www.mfe.govt.nz/publications/climate/.
New Zealand's net position under the Kyoto Protocol
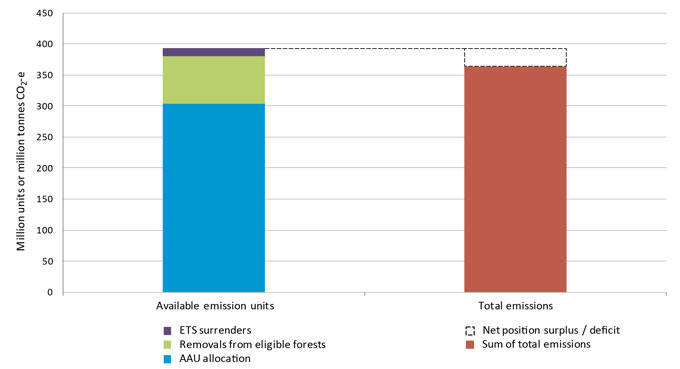
The latest projection of New Zealand's net position under the Kyoto Protocol is a surplus of 29.6 million units. New Zealand remains on track to meet our Kyoto Protocol target for the first commitment period.
How is the net position calculated?
The net position is New Zealand's forecast surplus or deficit of emissions units against our Kyoto Protocol target for 2008–2012. It is calculated as the difference between the emissions units we will have available and forecast total emissions over 2008–2012. Emissions data for 2008–2011 is taken from New Zealand's Greenhouse Gas Inventory: 1990–2011, and emissions data for 2012 has been projected. The net position in units is updated twice a year – first in April to include the latest estimates of emissions, and then in August to include additional Kyoto units surrendered through the NZ ETS. Because New Zealand's allocation of Assigned Amount Units (AAUs) is fixed, a small forecast change in either total emissions or in forestry removals, can have a large effect on the size of the net position, as figure 6 shows.
Figure 6: The net position calculation for 2008–2012
Read a description of this image
Why has the net position changed since the last update in August 2012?
The net position surplus has decreased by 5.8 million units, from 35.4 million units in August 2012. This is largely due to a projected increase in deforestation emissions, and is slightly offset by a decrease in estimated energy emissions.
Emissions from deforestation over the first commitment period are now projected to be 14.3 Mt CO2-e, 7.9 Mt CO2-e higher than projected in 2012. This is due to a combination of very low carbon prices and favourable prices for dairy products. World carbon prices have fallen from NZ$13 per tonne CO2-e in late 2011 to NZ$0.19 per tonne in January 2013. This has made conversion of pre-1990 planted forest to other land uses more economically viable.
Energy emissions over the first commitment period are now estimated to be 159.9 Mt CO2-e, 1.9 Mt CO2-e lower than projected in 2012. This drop in energy emissions from the 2012 net position was mainly due to actual (but still provisional) data being available for the 2012 calendar year. Emissions from transport and electricity generation were both much lower than was projected in the 2012 net position.
Changes in projected emissions from other sectors – agriculture, industrial processes, solvents and other product use, and waste – have been very minor. More detail on these changes and on the modelling methodology used to project future emissions is available on the net position webpage at www.mfe.govt.nz/issues/climate/greenhouse-gas-emissions/net-position/index.html.
The NZ ETS and the net position
Under the NZ ETS, participants with surrender obligations must surrender emission units to the Government for some or all of their emissions. These can be New Zealand Units (NZUs) that can only be used within the NZ ETS, or one of a variety of international unit types. These international units can be used to meet the Government's obligations under the Kyoto Protocol.
When NZ ETS participants surrender NZUs to the Government, these do not affect the net position. However, when NZ ETS participants surrender international Kyoto units to the Government, these are added to the net position and increase the surplus. The latest net position includes 13 million international units surrendered under the NZ ETS.
What are the projections of emissions for each sector?
The following table shows a breakdown of forecast emissions for each sector.
| Emissions and removals (million of tonnes of CO2 equivalent) | ||||||
|---|---|---|---|---|---|---|
| 2008 | 2009 | 2010 | 2011 | 2012 | Total | |
| Energy (including Transport) | 34.3 | 31.6 | 31.3 | 31.0 | 31.7 | 159.9 |
| Industrial processes and solvents | 4.3 | 4.3 | 4.8 | 5.5 | 4.4 | 23.3 |
| Agriculture | 33.3 | 33.5 | 33.7 | 34.4 | 35.2 | 170.2 |
| Waste | 2.1 | 2.0 | 2.0 | 2.0 | 2.0 | 10.1 |
| Forestry | ||||||
|
Net removals |
–15.3 | –15.5 | –15.9 | –15.6 | –14.9 | –77.2 |
|
2.8 | 2.7 | 2.5 | 2.8 | 3.5 | 14.3 |
|
–18.1 | –18.2 | –18.3 | –18.4 | –18.4 | –91.5 |
| Total | 58.8 | 56.0 | 56.0 | 57.2 | 58.4 | 286.3 |
Note: Forestry figures in this table refer to net emissions and removals under Article 3.3 of the Kyoto Protocol. Positive numbers refer to emissions of greenhouse gases, and negative numbers refer to removals/sequestration of greenhouse gases. Estimates of net removals for 2008–2011 here are different to those presented in New Zealand's Greenhouse Gas Inventory: 1990–2011. These differences are explained on the net position webpage at www.mfe.govt.nz/issues/climate/greenhouse-gas-emissions/net-position/index.html.
Kyoto financial position
The net position surplus in units represents a financial asset for the Crown. The value of the net position (the Kyoto financial position) changes as the price of emissions units and the exchange rate fluctuate. The latest value can be found on the Ministry's website at www.mfe.govt.nz/issues/climate/greenhouse-gas-emissions/net-position/index.html .
While the net position in units is updated twice a year, the Ministry updates the Kyoto financial position monthly for changes in the exchange rate, carbon price and for minor changes to the Government's unit balance.
Assigned Amount Units
An Assigned Amount Unit is a Kyoto unit representing an allowance to emit one metric tonne of carbon dioxide equivalent. AAUs are created (issued) up to the level of a Party's initial assigned amount. New Zealand's initial assigned amount is the 1990 level of emissions that was reviewed in 2007; 61.9 Mt CO2-e multiplied by 5 for the length of the commitment period. While we recalculate 1990 emissions as new science improves the estimates, New Zealand's level of AAUs is fixed.
For more information:
- about the state of New Zealand’s environment go to: www.mfe.govt.nz/environmental-reporting
- about climate change go to: www.mfe.govt.nz/issues/climate/
- about the Ministry for the Environment’s reporting on New Zealand’s greenhouse gases contact: info@mfe.govt.nz
Published in April 2013 by the
Ministry for the Environment
Manatu Mo Te Taiao
PO Box 10362
Wellington 6143
INFO 681
Back to footnote reference 1 Net emissions under UNFCCC reporting also include emissions from non-forest land categories that are excluded from Kyoto Protocol accounting.
Back to footnote reference 2 Net removals are expressed as a negative value to help the reader clarify the value is a removal and not an emission.
Back to footnote reference 3 Rhodes D, Novis J. 2002. The impact of incentives on the development of plantation forest resources in New Zealand. MAF Information Paper No: 45. MAF Policy Division. ISSN no: 1171-4654, ISBN no: 0-47807681-9. August 2002.
Back to footnote reference 4 UNFCCC. Emissions for 2010 http://unfccc.int/di/Indicators.do
Back to footnote reference 5 UNEP 2012. The Emissions Gap Report 2012. United Nations Environment Programme (UNEP), Nairobi. The estimate of 50.1 Gt CO2-e for global emissions in 2010 is based on data from the Emission Database for Global Atmospheric Research (EDGAR).
Back to footnote reference 6 A group of developed countries which took on commitments under the UNFCCC. http://unfccc.int/essential_background/glossary/items/3666.php
Back to footnote reference 7 UNFCCC. Annex 1 countries' emissions for 2010. http://unfccc.int/di/Indicators.do
Last updated: 12 April 2013
|
|
|
|
Copyright 2011 Energy and Technical Services Ltd. All Rights Reserved. Energyts.com |