
The world emits 48% more carbon dioxide from the consumption of energy now than it did in 1992 when the first Rio summit took place.
The new data shows the rise of Asia, big increases in emissions in Africa, how Europe has plateaued - and how Iran has shot up the league table.
China - the world's biggest emitter of CO2 - has increased by 240%, as
The new data, published by the US Energy Information Administration this week, is the most comprehensive carbon emissions data with statistics for over 200 countries around the world since 1980.
The world emitted 31.8bn tonnes of carbon dioxide from the consumption of energy in 2010 - up 6.7% on the year before. The figure is up by 48% on 1992, when the first Rio summit took place.
China - which only went into first place in 2006 - is racing ahead of the US, too. It emitted 8.3bn tonnes of CO2 in 2010 - up 240% on 1992, 15.5% on the previous year.
Meanwhile, US emissions are up for the first time since recession hit in 2008, in a sign of how closely pollution is linked to economic success.
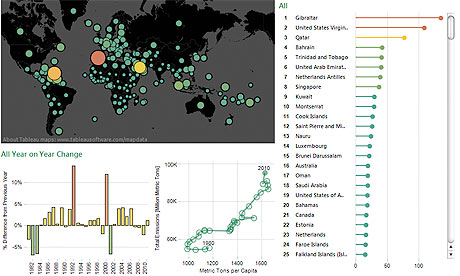
Here are some of the key facts:
• China now emits 48% more CO2 than the USA - and is responsible for a quarter of the world's emissions
• The UK's emissions are down 8% on 1992, and it has moved from 7th to 10th place since 1992
• In contrast, Iran has moved from 21st place to 8th place in 2010, overtaking the UK and Canada
• Gibraltar has the highest per capita emissions in the world - 135.3 tonnes per person per year, compared to 8.5 tonnes in the UK and 6.3 tonnes in China
There are other sources of emissions data too, if you want to compare - albeit not as up-to-date:
• The United Nations Framework Convention on Climate Change (UNFCCC) gathers the data on world carbon dioxide and other greenhouse gases. This is only available up to 2008.
• the International Energy Agency (IEA) has global carbon emissions data up to 2009
The full data from the EIA is below. What can you do with it?
Data summary
|
Rank, 2010
|
Country
|
Rank, 1992
|
Rank, 2009
|
Change in rank, 1992 to 2010
|
% change in emiss- ions, 1992 to 2010
|
Per person emiss- ions, 2010, tonnes
|
2010
|
|---|---|---|---|---|---|---|---|
| World total | 48 | 4.6 | 31,780.36 | ||||
| North America | 12 | 14.5 | 6,605.67 | ||||
| 176 | Bermuda | 173 | 175 | -3 | 81 | 11.9 | 0.81 |
| 9 | Canada | 9 | 7 | 0 | 13 | 16.3 | 548.75 |
| 183 | Greenland | 170 | 183 | -13 | 11 | 9.6 | 0.56 |
| 14 | Mexico | 14 | 13 | 0 | 42 | 4.0 | 445.28 |
| 205 | Saint Pierre and Miquelon | 184 | 212 | -21 | -34 | 25.7 | 0.15 |
| 2 | United States | 1 | 2 | -1 | 10 | 18.1 | 5,610.11 |
| Central & South America | 69 | 2.6 | 1,257.74 | ||||
| 192 | Antarctica | 185 | 193 | -7 | 40 | NA | 0.31 |
| 181 | Antigua and Barbuda | 174 | 181 | -7 | 72 | 8.3 | 0.72 |
| 31 | Argentina | 30 | 30 | -1 | 55 | 4.1 | 169.83 |
| 166 | Aruba | 161 | 168 | -5 | 81 | 11.9 | 1.24 |
| 120 | Bahamas | 133 | 122 | 13 | 151 | 18.0 | 5.57 |
| 156 | Barbados | 142 | 158 | -14 | 16 | 5.5 | 1.57 |
| 171 | Belize | 178 | 171 | 7 | 223 | 3.1 | 0.98 |
| 92 | Bolivia | 103 | 90 | 11 | 113 | 1.3 | 13.29 |
| 13 | Brazil | 19 | 15 | 6 | 91 | 2.3 | 453.87 |
| 200 | Cayman Islands | 179 | 187 | -21 | -10 | 5.4 | 0.27 |
| 49 | Chile | 61 | 51 | 12 | 118 | 4.1 | 68.76 |
| 46 | Colombia | 50 | 48 | 4 | 35 | 1.6 | 72.31 |
| 118 | Costa Rica | 114 | 113 | -4 | 76 | 1.4 | 6.41 |
| 74 | Cuba | 63 | 76 | -11 | 19 | 3.0 | 34.46 |
| 212 | Dominica | 204 | 211 | -8 | 139 | 1.9 | 0.14 |
| 83 | Dominican Republic | 93 | 82 | 10 | 90 | 2.0 | 19.60 |
| 78 | Ecuador | 75 | 77 | -3 | 33 | 1.7 | 24.43 |
| 117 | El Salvador | 119 | 119 | 2 | 101 | 1.1 | 6.48 |
| 213 | Falkland Islands | 208 | 214 | -5 | 80 | 14.6 | 0.05 |
| 169 | French Guiana | 164 | 167 | -5 | 77 | 5.9 | 1.12 |
| 187 | Grenada | 194 | 195 | 7 | 237 | 4.0 | 0.43 |
| 152 | Guadeloupe | 141 | 149 | -11 | 51 | 4.7 | 2.10 |
| 93 | Guatemala | 110 | 93 | 17 | 198 | 1.0 | 12.97 |
| 157 | Guyana | 154 | 157 | -3 | 72 | 2.0 | 1.52 |
| 158 | Haiti | 153 | 151 | -5 | 65 | 0.2 | 1.46 |
| 106 | Honduras | 125 | 105 | 19 | 203 | 1.0 | 8.29 |
| 102 | Jamaica | 97 | 96 | -5 | 8 | 3.2 | 9.22 |
| 145 | Martinique | 138 | 145 | -7 | 89 | 6.5 | 2.77 |
| 210 | Montserrat | 207 | 209 | -3 | 256 | 28.7 | 0.15 |
| 104 | Netherlands Antilles | 95 | 100 | -9 | -8 | 38.5 | 8.82 |
| 125 | Nicaragua | 130 | 129 | 5 | 106 | 0.8 | 4.82 |
| 88 | Panama | 88 | 89 | 0 | 26 | 4.5 | 15.46 |
| 128 | Paraguay | 131 | 130 | 3 | 89 | 0.7 | 4.39 |
| 67 | Peru | 73 | 70 | 6 | 108 | 1.4 | 41.88 |
| 75 | Puerto Rico | 69 | 74 | -6 | 32 | 7.8 | 30.86 |
| 193 | Saint Kitts and Nevis | 201 | 194 | 8 | 298 | 6.1 | 0.30 |
| 186 | Saint Lucia | 188 | 186 | 2 | 145 | 2.7 | 0.43 |
| 190 | Saint Vincent/Grenadines | 199 | 200 | 9 | 301 | 3.2 | 0.33 |
| 151 | Suriname | 139 | 152 | -12 | 63 | 4.8 | 2.34 |
| 62 | Trinidad and Tobago | 76 | 64 | 14 | 187 | 40.6 | 49.93 |
| 215 | Turks and Caicos Islands | 213 | 1.7 | 0.04 | |||
| 112 | Uruguay | 109 | 109 | -3 | 61 | 2.1 | 7.27 |
| 32 | Venezuela | 29 | 31 | -3 | 42 | 5.8 | 158.44 |
| 96 | Virgin Islands, U.S. | 98 | 95 | 2 | 43 | 108.9 | 11.95 |
| 208 | Virgin Islands, British | 205 | 207 | -3 | 173 | 5.9 | 0.15 |
| Europe | 1 | 7.2 | 4,370.29 | ||||
| 124 | Albania | 113 | 127 | -11 | 29 | 1.6 | 4.89 |
| 48 | Austria | 49 | 49 | 1 | 22 | 8.5 | 69.46 |
| 34 | Belgium | 28 | 34 | -6 | 2 | 12.2 | 127.19 |
| 82 | Bosnia and Herzegovina | 74 | 80 | -8 | 6 | 4.4 | 20.14 |
| 66 | Bulgaria | 48 | 67 | -18 | -27 | 5.9 | 42.17 |
| 80 | Croatia | 78 | 81 | -2 | 41 | 5.2 | 23.43 |
| 101 | Cyprus | 105 | 101 | 4 | 53 | 8.4 | 9.26 |
| 40 | Czech Republic | 40 | -40 | 8.9 | 90.83 | ||
| 64 | Denmark | 44 | 62 | -20 | -25 | 8.3 | 45.96 |
| 179 | Faroe Islands | 165 | 178 | -14 | 21 | 15.2 | 0.74 |
| 59 | Finland | 51 | 58 | -8 | 10 | 10.4 | 54.40 |
| Former Czechoslovakia | 24 | -- | -- | ||||
| Former Serbia and Montenegro | 55 | -- | -- | ||||
| Former Yugoslavia | -- | -- | |||||
| 17 | France | 11 | 18 | -6 | 3 | 6.2 | 395.20 |
| 6 | Germany | 5 | 6 | -1 | -11 | 9.6 | 793.66 |
| Germany, East | -- | -- | |||||
| Germany, West | -- | -- | |||||
| 130 | Gibraltar | 122 | 128 | -8 | 26 | 135.3 | 3.91 |
| 39 | Greece | 39 | 39 | 0 | 17 | 8.7 | 92.99 |
| 61 | Hungary | 43 | 60 | -18 | -20 | 5.0 | 50.39 |
| 138 | Iceland | 132 | 135 | -6 | 45 | 10.9 | 3.36 |
| 69 | Ireland | 64 | 68 | -5 | 47 | 8.8 | 40.48 |
| 15 | Italy | 10 | 17 | -5 | 0 | 7.2 | 416.37 |
| 98 | Luxembourg | 90 | 99 | -8 | -4 | 21.7 | 10.80 |
| 108 | Macedonia, FYR | 96 | 104 | -12 | -12 | 4.0 | 8.23 |
| 140 | Malta | 129 | 138 | -11 | 31 | 7.7 | 3.11 |
| 154 | Montenegro | 153 | 2.9 | 1.94 | |||
| 25 | Netherlands | 22 | 25 | -3 | 24 | 15.7 | 263.44 |
| 68 | Norway | 59 | 66 | -9 | 17 | 8.9 | 41.80 |
| 21 | Poland | 12 | 20 | -9 | -7 | 7.9 | 303.70 |
| 60 | Portugal | 52 | 55 | -8 | 8 | 4.8 | 51.43 |
| 45 | Romania | 27 | 43 | -18 | -40 | 3.6 | 78.43 |
| 63 | Serbia | 61 | 5.5 | 49.92 | |||
| 73 | Slovakia | 73 | 6.3 | 34.54 | |||
| 86 | Slovenia | 87 | 85 | 1 | 38 | 8.7 | 17.42 |
| 19 | Spain | 18 | 19 | -1 | 31 | 6.8 | 316.43 |
| 54 | Sweden | 46 | 59 | -8 | 6 | 6.9 | 62.74 |
| 65 | Switzerland | 54 | 65 | -11 | -1 | 5.9 | 45.55 |
| 24 | Turkey | 25 | 24 | 1 | 91 | 3.4 | 263.54 |
| 10 | United Kingdom | 7 | 10 | -3 | -8 | 8.5 | 532.44 |
| Eurasia | -24 | 8.7 | 2,454.13 | ||||
| 97 | Armenia | 92 | 98 | -5 | 4 | 3.9 | 11.56 |
| 72 | Azerbaijan | 45 | 72 | -27 | -42 | 4.2 | 35.12 |
| 50 | Belarus | 37 | 52 | -13 | -25 | 7.1 | 68.24 |
| 81 | Estonia | 65 | 86 | -16 | -20 | 15.9 | 20.56 |
| Former U.S.S.R. | -- | -- | |||||
| 122 | Georgia | 81 | 120 | -41 | -66 | 1.2 | 5.30 |
| 28 | Kazakhstan | 17 | 29 | -11 | -29 | 11.9 | 184.47 |
| 129 | Kyrgyzstan | 82 | 123 | -47 | -71 | 0.7 | 4.13 |
| 103 | Latvia | 86 | 103 | -17 | -29 | 4.1 | 9.07 |
| 87 | Lithuania | 70 | 87 | -17 | -31 | 4.5 | 15.98 |
| 110 | Moldova | 71 | 111 | -39 | -64 | 1.7 | 7.38 |
| 4 | Russia | 3 | 4 | -1 | -19 | 11.7 | 1,633.80 |
| 115 | Tajikistan | 100 | 116 | -15 | -16 | 0.9 | 6.68 |
| 55 | Turkmenistan | 72 | 54 | 17 | 203 | 12.6 | 62.05 |
| 23 | Ukraine | 8 | 22 | -15 | -48 | 6.1 | 275.51 |
| 36 | Uzbekistan | 34 | 35 | -2 | 19 | 4.1 | 114.27 |
| Middle East | 119 | 8.4 | 1,785.93 | ||||
| 76 | Bahrain | 83 | 75 | 7 | 126 | 41.6 | 30.69 |
| 8 | Iran | 21 | 8 | 13 | 139 | 7.3 | 560.33 |
| 35 | Iraq | 47 | 37 | 12 | 105 | 4.0 | 118.31 |
| 47 | Israel | 57 | 46 | 10 | 68 | 9.6 | 70.32 |
| 84 | Jordan | 91 | 83 | 7 | 70 | 3.0 | 19.07 |
| 43 | Kuwait | 68 | 42 | 25 | 246 | 29.2 | 81.33 |
| 89 | Lebanon | 99 | 88 | 10 | 87 | 3.7 | 15.24 |
| 58 | Oman | 84 | 63 | 26 | 308 | 18.6 | 55.20 |
| 136 | Palestine, Occupied Territory | 137 | 0.8 | 3.38 | |||
| 51 | Qatar | 66 | 50 | 15 | 153 | 76.9 | 64.68 |
| 11 | Saudi Arabia | 20 | 12 | 9 | 103 | 18.6 | 478.41 |
| 53 | Syria | 60 | 53 | 7 | 78 | 2.8 | 63.10 |
| 26 | United Arab Emirates | 32 | 26 | 6 | 95 | 40.1 | 199.37 |
| 77 | Yemen | 89 | 78 | 12 | 117 | 1.1 | 26.50 |
| Africa | 51 | 1.1 | 1,145.16 | ||||
| 38 | Algeria | 38 | 36 | 0 | 35 | 3.2 | 110.90 |
| 79 | Angola | 101 | 79 | 22 | 222 | 1.9 | 24.20 |
| 133 | Benin | 158 | 134 | 25 | 377 | 0.4 | 3.65 |
| 131 | Botswana | 120 | 132 | -11 | 20 | 1.9 | 3.84 |
| 160 | Burkina Faso | 167 | 159 | 7 | 147 | 0.1 | 1.44 |
| 184 | Burundi | 177 | 189 | -7 | 67 | 0.1 | 0.53 |
| 111 | Cameroon | 116 | 108 | 5 | 105 | 0.4 | 7.36 |
| 201 | Cape Verde | 196 | 190 | -5 | 154 | 0.5 | 0.27 |
| 202 | Central African Republic | 182 | 196 | -20 | -15 | 0.0 | 0.23 |
| 197 | Chad | 176 | 198 | -21 | -11 | 0.0 | 0.29 |
| 207 | Comoros | 202 | 206 | -5 | 122 | 0.2 | 0.15 |
| 116 | Congo | 156 | 118 | 40 | 664 | 1.6 | 6.52 |
| 144 | Congo, Dem Rep | 111 | 144 | -33 | -35 | 0.0 | 2.80 |
| 119 | Cote dIvoire | 112 | 115 | -7 | 54 | 0.3 | 5.94 |
| 150 | Djibouti | 135 | 155 | -15 | 32 | 3.2 | 2.35 |
| 27 | Egypt | 36 | 27 | 9 | 110 | 2.4 | 196.55 |
| 123 | Equatorial Guinea | 195 | 121 | 72 | 3990 | 7.7 | 5.00 |
| 177 | Eritrea | 176 | 0.1 | 0.80 | |||
| 113 | Ethiopia | 115 | 112 | 2 | 85 | 0.1 | 6.74 |
| 126 | Gabon | 104 | 125 | -22 | -24 | 3.0 | 4.59 |
| 196 | Gambia | 187 | 185 | -9 | 43 | 0.2 | 0.29 |
| 99 | Ghana | 117 | 106 | 18 | 210 | 0.4 | 10.58 |
| 161 | Guinea | 145 | 162 | -16 | 18 | 0.1 | 1.39 |
| 185 | Guinea-Bissau | 181 | 184 | -4 | 57 | 0.3 | 0.46 |
| 95 | Kenya | 102 | 97 | 7 | 87 | 0.3 | 12.25 |
| 198 | Lesotho | 190 | 201 | -8 | 74 | 0.1 | 0.28 |
| 180 | Liberia | 175 | 180 | -5 | 112 | 0.2 | 0.74 |
| 56 | Libya | 58 | 56 | 2 | 66 | 9.4 | 60.60 |
| 135 | Madagascar | 150 | 136 | 15 | 216 | 0.2 | 3.38 |
| 162 | Malawi | 162 | 164 | 0 | 105 | 0.1 | 1.36 |
| 174 | Mali | 172 | 177 | -2 | 80 | 0.1 | 0.89 |
| 143 | Mauritania | 118 | 141 | -25 | -13 | 0.9 | 2.89 |
| 127 | Mauritius | 134 | 126 | 7 | 113 | 3.5 | 4.55 |
| 71 | Morocco | 67 | 71 | -4 | 50 | 1.1 | 35.66 |
| 146 | Mozambique | 144 | 146 | -2 | 129 | 0.1 | 2.73 |
| 132 | Namibia | 146 | 133 | 14 | 232 | 1.8 | 3.81 |
| 155 | Niger | 148 | 160 | -7 | 60 | 0.1 | 1.80 |
| 44 | Nigeria | 35 | 44 | -9 | -14 | 0.5 | 80.51 |
| 142 | Reunion | 140 | 143 | -2 | 112 | 3.9 | 2.96 |
| 175 | Rwanda | 159 | 179 | -16 | 18 | 0.1 | 0.87 |
| 216 | Saint Helena | 210 | 216 | -6 | 374 | 2.0 | 0.02 |
| 206 | Sao Tome and Principe | 200 | 205 | -6 | 95 | 0.9 | 0.15 |
| 114 | Senegal | 124 | 117 | 10 | 129 | 0.5 | 6.68 |
| 165 | Seychelles | 169 | 169 | 4 | 146 | 14.1 | 1.25 |
| 163 | Sierra Leone | 157 | 161 | -6 | 65 | 0.3 | 1.33 |
| 173 | Somalia | 168 | 173 | -5 | 59 | 0.1 | 0.90 |
| 12 | South Africa | 13 | 11 | 1 | 45 | 9.5 | 465.10 |
| 91 | Sudan and South Sudan | 107 | 91 | 16 | 167 | 0.3 | 13.79 |
| 170 | Swaziland | 163 | 166 | -7 | 72 | 0.8 | 1.11 |
| 109 | Tanzania | 126 | 114 | 17 | 194 | 0.2 | 7.57 |
| 139 | Togo | 160 | 142 | 21 | 338 | 0.5 | 3.17 |
| 85 | Tunisia | 85 | 84 | 0 | 46 | 1.8 | 18.72 |
| 153 | Uganda | 151 | 154 | -2 | 109 | 0.1 | 2.01 |
| 191 | Western Sahara | 186 | 192 | -5 | 42 | 0.6 | 0.31 |
| 149 | Zambia | 123 | 148 | -26 | -19 | 0.2 | 2.42 |
| 105 | Zimbabwe | 79 | 102 | -26 | -49 | 0.7 | 8.49 |
| Asia & Oceania | 150 | 3.7 | 14,161.44 | ||||
| 178 | Afghanistan | 137 | 174 | -41 | -55 | 0.0 | 0.79 |
| 182 | American Samoa | 166 | 182 | -16 | 15 | 10.4 | 0.69 |
| 16 | Australia | 16 | 16 | 0 | 47 | 18.8 | 405.34 |
| 57 | Bangladesh | 80 | 57 | 23 | 244 | 0.4 | 56.74 |
| 199 | Bhutan | 193 | 191 | -6 | 110 | 0.4 | 0.28 |
| 107 | Brunei | 121 | 110 | 14 | 163 | 20.9 | 8.27 |
| 94 | Burma | 108 | 94 | 14 | 177 | 0.2 | 12.80 |
| 134 | Cambodia | 171 | 131 | 37 | 619 | 0.2 | 3.59 |
| 1 | China | 2 | 1 | 1 | 240 | 6.3 | 8,320.96 |
| 194 | Cook Islands | 206 | 204 | 12 | 531 | 26.3 | 0.30 |
| 148 | Fiji | 152 | 150 | 4 | 179 | 2.9 | 2.50 |
| 167 | French Polynesia | 155 | 170 | -12 | 40 | 4.2 | 1.22 |
| 159 | Guam | 128 | 156 | -31 | -42 | 8.0 | 1.45 |
| Hawaiian Trade Zone | -- | -- | |||||
| 42 | Hong Kong | 56 | 41 | 14 | 86 | 11.8 | 83.78 |
| 3 | India | 6 | 3 | 3 | 157 | 1.4 | 1,695.62 |
| 18 | Indonesia | 23 | 14 | 5 | 116 | 1.6 | 389.43 |
| 5 | Japan | 4 | 5 | -1 | 8 | 9.2 | 1,164.47 |
| 214 | Kiribati | 209 | 215 | -5 | 96 | 0.4 | 0.04 |
| 52 | Korea, North | 31 | 47 | -21 | -40 | 2.8 | 63.69 |
| 7 | Korea, South | 15 | 9 | 8 | 97 | 11.9 | 578.97 |
| 168 | Laos | 183 | 165 | 15 | 344 | 0.2 | 1.19 |
| 147 | Macau | 147 | 147 | 0 | 124 | 4.5 | 2.54 |
| 29 | Malaysia | 40 | 28 | 11 | 150 | 6.4 | 181.93 |
| 172 | Maldives | 197 | 172 | 25 | 802 | 2.3 | 0.92 |
| 100 | Mongolia | 94 | 107 | -6 | -5 | 3.1 | 9.44 |
| 203 | Nauru | 191 | 202 | -12 | 37 | 23.7 | 0.22 |
| 137 | Nepal | 149 | 139 | 12 | 202 | 0.1 | 3.36 |
| 141 | New Caledonia | 136 | 140 | -5 | 71 | 12.0 | 3.03 |
| 70 | New Zealand | 62 | 69 | -8 | 32 | 9.3 | 39.58 |
| 217 | Niue | 211 | 217 | -6 | 96 | 2.9 | 0.01 |
| 33 | Pakistan | 41 | 33 | 8 | 116 | 0.8 | 151.65 |
| 121 | Papua New Guinea | 127 | 124 | 6 | 106 | 0.9 | 5.31 |
| 41 | Philippines | 53 | 45 | 12 | 86 | 0.9 | 85.63 |
| 209 | Samoa | 192 | 208 | -17 | 10 | 0.8 | 0.15 |
| 30 | Singapore | 42 | 32 | 12 | 153 | 36.6 | 172.19 |
| 189 | Solomon Islands | 189 | 199 | 0 | 108 | 0.6 | 0.36 |
| 90 | Sri Lanka | 106 | 92 | 16 | 150 | 0.7 | 14.09 |
| 20 | Taiwan | 26 | 21 | 6 | 132 | 13.3 | 305.38 |
| 22 | Thailand | 33 | 23 | 11 | 176 | 4.2 | 278.49 |
| 188 | Timor-Leste (East Timor) | 188 | 0.3 | 0.40 | |||
| 204 | Tonga | 198 | 203 | -6 | 55 | 1.3 | 0.16 |
| 195 | U.S. Pacific Islands | 180 | 197 | -15 | -0 | 1.2 | 0.29 |
| 211 | Vanuatu | 203 | 210 | -8 | 125 | 0.7 | 0.15 |
| 37 | Vietnam | 77 | 38 | 40 | 549 | 1.3 | 112.80 |
| 164 | Wake Island | 143 | 163 | -21 | 2 | 1.29 | |