 |
| Reviews and Templates for Expression We |
World carbon dioxide emissions data by country: China speeds ahead of the rest
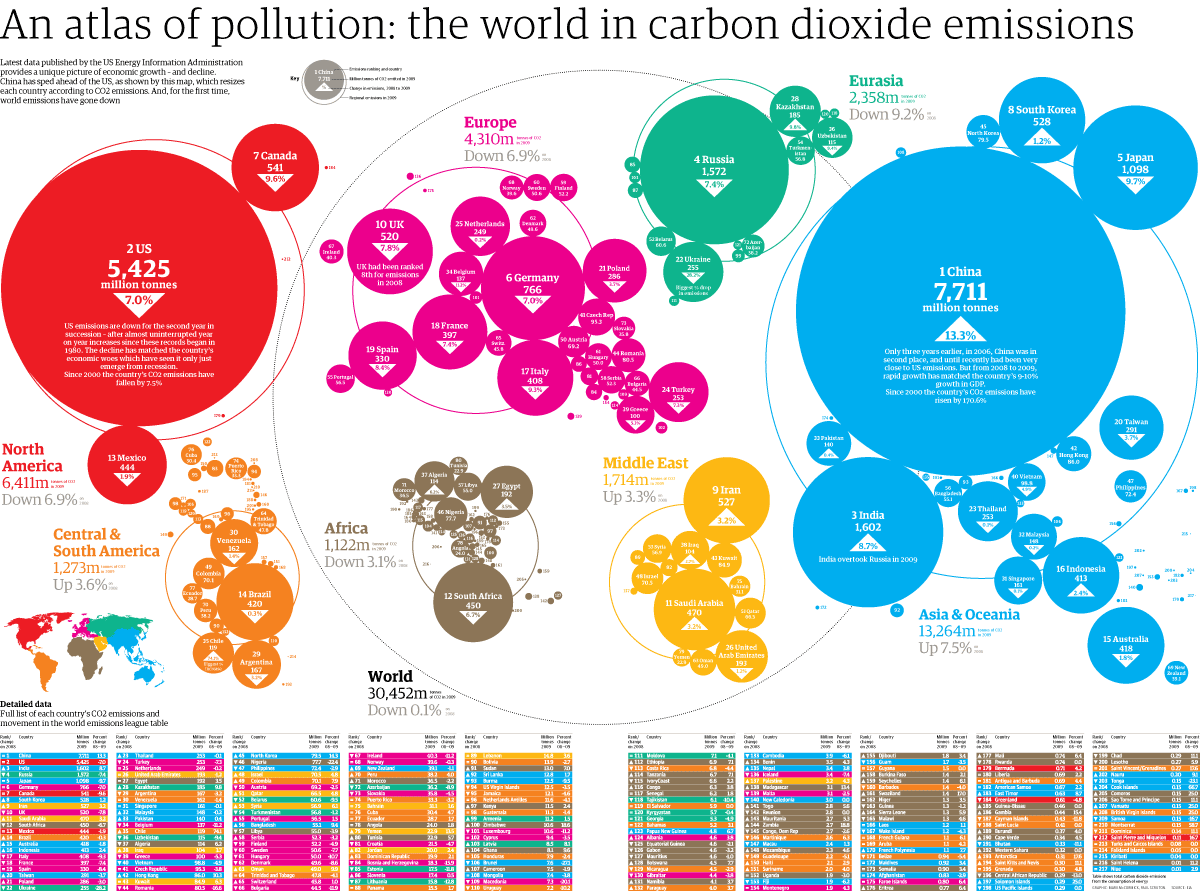
World carbon dioxide emissions by country: click image for graphic and download
World carbon dioxide emissions are one way of measuring a country's economic growth too.
And the latest figures - published by the respected Energy Information Administration - show CO2 emissions from energy consumption - the vast majority of Carbon Dioxide produced.
A reduction in global greenhouse gas emissions is not only the goal of environmentalists but also of pretty much every government in the world. Currently 192 countries have adopted the Kyoto protocol with the aim of collectively reducing greenhouse gas emissions by 5% of the 1990 levels by 2012.
The map, above (you can get it as a PDF file here) is produced by Guardian graphic artists Mark McCormick and Paul Scruton. It shows a world where established economies have large - but declining - carbon emissions. While the new economic giants are growing rapidly. This newly-released data is from 2009 - the latest available.
On pure emissions alone, the key points are:
Download this graphic as a PDF file here• China emits more CO2 than the US and Canada put together - up by 171% since the year 2000
• The US has had declining CO2 for two years running, the last time the US had declining CO2 for 3 years running was in the 1980s
• The UK is down one place to tenth on the list, 8% on the year. The country is now behind Iran, South Korea, Japan and Germany
• India is now the world's third biggest emitter of CO2 - pushing Russia into fourth place
• The biggest decrease from 2008-2009 is Ukraine - down 28%. The biggest increase is the Cook Islands - up 66.7%
But that is only one way to look at the data - and it doesn't take account of how many people live in each country. If you look at per capita emissions, a different picture emerges where:
• Some of the world's smallest countries and islands emit the most per person - the highest being Gibraltar with 152 tonnes per person
• The US is still number one in terms of per capita emissions among the big economies - with 18 tonnes emitted per person
• China, by contrast, emits under six tonnes per person, India only 1.38
• For comparison, the whole world emits 4.49 tonnes per person
There are other sources of emissions data too, if you want to compare - albeit not as up-to-date:
• The United Nations Framework Convention on Climate Change (UNFCCC) gathers the data on world carbon dioxide and other greenhouse gases. This is only available up to 2008.
• the International Energy Agency (IEA) has global carbon emissions data up to 2008
But what can we say about this data and how close we are to the collective targets in the Kyoto agreement?
The Kyoto protocol target emission does not include international aviation and shipping emissions, but this EIA data does. You can't tell this from the notes on the data, but the EIA confirmed to us this was the case.
We can determine what the so called 'bunker fuels' are from the data here.
But only looking at carbon dioxide emissions doesn't give us the total for all greenhouse gases.
So we'll have to wait until the UNFCCC publishes the results of global greenhouse gasses collated data before we can draw any firm conclusions about meeting the Kyoto agreements.
The full data is below, going right back to 1980. What can you do with it?
Data summary
|
Table id
|
Rank, 2009
|
Country or region
|
2008, mil tonnes
|
2009, TOTAL, mil tonnes
|
2009, per capita, tonnes
|
% change, 2008 to 2009
|
|---|---|---|---|---|---|---|
|
Source: International Energy Statistics <a href="http://tonto.eia.doe.gov/cfapps/ipdbproject |
||||||
| 225 | World | 30,493.23 | 30,398.42 | 4.49 | -0.3 | |
| 179 | Asia & Oceania | 12,338.41 | 13,264.09 | 3.53 | 7.5 | |
| 188 | 1 | China | 6,803.92 | 7,710.50 | 5.83 | 13.3 |
| 1 | North America | 6,885.07 | 6,410.54 | 14.19 | -6.9 | |
| 7 | 2 | United States | 5,833.13 | 5,424.53 | 17.67 | -7 |
| 54 | Europe | 4,628.98 | 4,310.30 | 7.14 | -6.9 | |
| 91 | Eurasia | 2,595.86 | 2,358.03 | 8.32 | -9.2 | |
| 107 | Middle East | 1,658.55 | 1,714.09 | 8.22 | 3.3 | |
| 194 | 3 | India | 1,473.73 | 1,602.12 | 1.38 | 8.7 |
| 102 | 4 | Russia | 1,698.38 | 1,572.07 | 11.23 | -7.4 |
| 8 | Central & South America | 1,228.65 | 1,219.78 | 2.57 | 0.7 | |
| 122 | Africa | 1,157.71 | 1,121.59 | 1.13 | -3.1 | |
| 196 | 5 | Japan | 1,215.48 | 1,097.96 | 8.64 | -9.7 |
| 67 | 6 | Germany | 823.07 | 765.56 | 9.30 | -7 |
| 3 | 7 | Canada | 598.46 | 540.97 | 16.15 | -9.6 |
| 199 | 8 | Korea, South | 521.77 | 528.13 | 10.89 | 1.2 |
| 109 | 9 | Iran | 510.61 | 527.18 | 6.94 | 3.2 |
| 90 | 10 | United Kingdom | 563.88 | 519.94 | 8.35 | -7.8 |
| 118 | 11 | Saudi Arabia | 455.62 | 470.00 | 18.56 | 3.2 |
| 169 | 12 | South Africa | 482.88 | 450.44 | 9.18 | -6.7 |
| 5 | 13 | Mexico | 452.05 | 443.61 | 3.99 | -1.9 |
| 17 | 14 | Brazil | 421.60 | 420.16 | 2.11 | -0.3 |
| 182 | 15 | Australia | 425.34 | 417.68 | 19.64 | -1.8 |
| 195 | 16 | Indonesia | 403.74 | 413.29 | 1.72 | 2.4 |
| 73 | 17 | Italy | 449.75 | 407.87 | 7.01 | -9.3 |
| 66 | 18 | France | 428.54 | 396.65 | 6.30 | -7.4 |
| 86 | 19 | Spain | 360.13 | 329.86 | 7.13 | -8.4 |
| 217 | 20 | Taiwan | 301.94 | 290.88 | 12.66 | -3.7 |
| 80 | 21 | Poland | 294.78 | 285.79 | 7.43 | -3 |
| 105 | 22 | Ukraine | 355.48 | 255.07 | 5.58 | -28.2 |
| 218 | 23 | Thailand | 253.55 | 253.38 | 3.80 | -0.1 |
| 89 | 24 | Turkey | 272.90 | 253.06 | 3.29 | -7.3 |
| 78 | 25 | Netherlands | 249.50 | 248.91 | 14.89 | -0.2 |
| 120 | 26 | United Arab Emirates | 195.85 | 193.43 | 40.31 | -1.2 |
| 138 | 27 | Egypt | 185.85 | 192.38 | 2.44 | 3.5 |
| 97 | 28 | Kazakhstan | 168.48 | 185.06 | 12.02 | 9.8 |
| 11 | 29 | Argentina | 172.47 | 166.92 | 4.08 | -3.2 |
| 51 | 30 | Venezuela | 164.31 | 161.96 | 6.04 | -1.4 |
| 214 | 31 | Singapore | 161.23 | 161.12 | 34.59 | -0.1 |
| 202 | 32 | Malaysia | 148.30 | 148.01 | 5.32 | -0.2 |
| 210 | 33 | Pakistan | 139.71 | 140.29 | 0.77 | 0.4 |
| 57 | 34 | Belgium | 154.76 | 137.36 | 13.19 | -11.2 |
| 106 | 35 | Uzbekistan | 127.10 | 115.16 | 4.17 | -9.4 |
| 123 | 36 | Algeria | 107.28 | 113.92 | 3.33 | 6.2 |
| 110 | 37 | Iraq | 100.00 | 103.70 | 3.58 | 3.7 |
| 69 | 38 | Greece | 106.04 | 100.37 | 9.35 | -5.3 |
| 223 | 39 | Vietnam | 103.86 | 98.76 | 1.12 | -4.9 |
| 62 | 40 | Czech Republic | 99.10 | 95.32 | 9.33 | -3.8 |
| 193 | 41 | Hong Kong | 77.92 | 85.98 | 12.19 | 10.3 |
| 113 | 42 | Kuwait | 79.83 | 84.87 | 31.52 | 6.3 |
| 82 | 43 | Romania | 96.56 | 80.52 | 3.66 | -16.6 |
| 198 | 44 | Korea, North | 69.57 | 79.55 | 3.51 | 14.3 |
| 160 | 45 | Nigeria | 100.16 | 77.75 | 0.52 | -22.4 |
| 212 | 46 | Philippines | 74.57 | 72.39 | 0.74 | -2.9 |
| 111 | 47 | Israel | 67.26 | 70.48 | 9.74 | 4.8 |
| 20 | 48 | Colombia | 64.99 | 70.15 | 1.61 | 7.9 |
| 56 | 49 | Austria | 71.01 | 69.24 | 8.43 | -2.5 |
| 117 | 50 | Qatar | 63.45 | 66.52 | 79.82 | 4.8 |
| 19 | 51 | Chile | 68.30 | 65.70 | 3.96 | -3.81 |
| 94 | 52 | Belarus | 66.93 | 60.57 | 6.28 | -9.5 |
| 119 | 53 | Syria | 53.60 | 56.88 | 2.61 | 6.1 |
| 104 | 54 | Turkmenistan | 57.48 | 56.78 | 11.62 | -1.2 |
| 81 | 55 | Portugal | 55.74 | 56.55 | 5.28 | 1.5 |
| 183 | 56 | Bangladesh | 50.39 | 55.13 | 0.36 | 9.4 |
| 150 | 57 | Libya | 57.24 | 55.03 | 8.70 | -3.9 |
| 83 | 58 | Serbia | 54.08 | 52.33 | 5.70 | -3.2 |
| 65 | 59 | Finland | 54.86 | 52.15 | 9.93 | -4.9 |
| 87 | 60 | Sweden | 54.77 | 50.56 | 5.58 | -7.7 |
| 70 | 61 | Hungary | 56.05 | 50.03 | 5.00 | -10.7 |
| 63 | 62 | Denmark | 54.22 | 49.56 | 9.01 | -8.6 |
| 115 | 63 | Oman | 44.56 | 48.96 | 16.83 | 9.9 |
| 48 | 64 | Trinidad and Tobago | 49.89 | 47.82 | 38.88 | -4.1 |
| 88 | 65 | Switzerland | 45.34 | 45.81 | 6.00 | 1 |
| 59 | 66 | Bulgaria | 50.46 | 44.46 | 6.17 | -11.9 |
| 72 | 67 | Ireland | 45.37 | 40.27 | 8.79 | -11.2 |
| 79 | 68 | Norway | 39.69 | 39.58 | 8.49 | -0.3 |
| 208 | 69 | New Zealand | 39.51 | 39.07 | 9.28 | -1.1 |
| 42 | 70 | Peru | 36.71 | 38.19 | 1.29 | 4 |
| 156 | 71 | Morocco | 37.30 | 36.49 | 1.17 | -2.2 |
| 93 | 72 | Azerbaijan | 39.69 | 36.16 | 4.39 | -8.9 |
| 84 | 73 | Slovakia | 37.42 | 35.75 | 6.54 | -4.5 |
| 43 | 74 | Puerto Rico | 34.37 | 33.26 | 8.38 | -3.2 |
| 108 | 75 | Bahrain | 30.63 | 31.10 | 42.68 | 1.6 |
| 22 | 76 | Cuba | 29.01 | 30.37 | 2.65 | 4.7 |
| 25 | 77 | Ecuador | 28.24 | 28.71 | 1.97 | 1.7 |
| 124 | 78 | Angola | 23.57 | 24.00 | 1.88 | 1.8 |
| 121 | 79 | Yemen | 20.19 | 22.92 | 1.00 | 13.5 |
| 174 | 80 | Tunisia | 21.67 | 22.90 | 2.18 | 5.7 |
| 60 | 81 | Croatia | 22.60 | 21.54 | 4.80 | -4.7 |
| 112 | 82 | Jordan | 19.54 | 20.02 | 3.19 | 2.4 |
| 24 | 83 | Dominican Republic | 19.45 | 19.86 | 2.05 | 2.1 |
| 58 | 84 | Bosnia and Herzegovina | 21.81 | 18.35 | 3.98 | -15.9 |
| 95 | 85 | Estonia | 19.83 | 17.49 | 13.46 | -11.8 |
| 85 | 86 | Slovenia | 17.28 | 17.37 | 8.66 | 0.5 |
| 100 | 87 | Lithuania | 18.07 | 15.75 | 4.43 | -12.8 |
| 40 | 88 | Panama | 15.20 | 15.46 | 4.60 | 1.7 |
| 114 | 89 | Lebanon | 14.32 | 14.84 | 3.62 | 3.6 |
| 16 | 90 | Bolivia | 14.27 | 13.89 | 1.42 | -2.7 |
| 170 | 91 | Sudan | 12.19 | 13.04 | 0.30 | 7 |
| 216 | 92 | Sri Lanka | 12.54 | 12.76 | 0.60 | 1.7 |
| 186 | 93 | Burma | 13.87 | 12.54 | 0.24 | -9.5 |
| 52 | 94 | Virgin Islands, U.S. | 12.93 | 12.49 | 113.71 | -3.5 |
| 35 | 95 | Jamaica | 12.70 | 12.11 | 4.29 | -4.6 |
| 38 | 96 | Netherlands Antilles | 12.13 | 11.64 | 51.26 | -4.1 |
| 147 | 97 | Kenya | 11.23 | 11.50 | 0.29 | 2.4 |
| 31 | 98 | Guatemala | 11.46 | 11.30 | 0.85 | -1.4 |
| 92 | 99 | Armenia | 11.06 | 11.23 | 3.79 | 1.5 |
| 178 | 100 | Zimbabwe | 8.95 | 10.61 | 0.93 | 18.6 |
| 74 | 101 | Luxembourg | 11.92 | 10.58 | 21.51 | -11.2 |
| 61 | 102 | Cyprus | 9.77 | 9.42 | 8.68 | -3.5 |
| 99 | 103 | Latvia | 7.89 | 8.53 | 3.82 | 8.1 |
| 144 | 104 | Ghana | 7.40 | 8.11 | 0.34 | 9.6 |
| 34 | 105 | Honduras | 8.13 | 7.94 | 1.01 | -2.4 |
| 185 | 106 | Brunei | 10.40 | 7.58 | 19.53 | -27.1 |
| 129 | 107 | Cameroon | 7.63 | 7.48 | 0.40 | -1.9 |
| 204 | 108 | Mongolia | 7.65 | 7.36 | 2.42 | -3.8 |
| 75 | 109 | Macedonia | 9.18 | 7.34 | 3.55 | -20.1 |
| 50 | 110 | Uruguay | 8.06 | 7.24 | 2.07 | -10.2 |
| 101 | 111 | Moldova | 7.36 | 7.05 | 1.63 | -4.1 |
| 141 | 112 | Ethiopia | 6.42 | 6.88 | 0.08 | 7.1 |
| 21 | 113 | Costa Rica | 7.14 | 6.83 | 1.53 | -4.4 |
| 172 | 114 | Tanzania | 6.25 | 6.69 | 0.16 | 7.1 |
| 136 | 115 | Cote dIvoire (IvoryCoast) | 6.49 | 6.63 | 0.32 | 2.2 |
| 134 | 116 | Congo | 6.09 | 6.32 | 1.57 | 3.8 |
| 165 | 117 | Senegal | 6.14 | 6.25 | 0.52 | 1.8 |
| 103 | 118 | Tajikistan | 6.84 | 6.13 | 0.83 | -10.4 |
| 26 | 119 | El Salvador | 5.91 | 5.91 | 0.98 | 0 |
| 98 | 120 | Kyrgyzstan | 5.67 | 5.65 | 1.04 | -0.4 |
| 96 | 121 | Georgia | 5.60 | 5.32 | 1.15 | -4.9 |
| 13 | 122 | Bahamas | 5.09 | 5.25 | 3.1 | |
| 211 | 123 | Papua New Guinea | 4.50 | 4.81 | 0.81 | 6.7 |
| 55 | 124 | Albania | 4.45 | 4.62 | 1.55 | 3.8 |
| 139 | 125 | Equatorial Guinea | 4.71 | 4.61 | 7.28 | -2.1 |
| 142 | 126 | Gabon | 4.72 | 4.57 | 3.02 | -3.2 |
| 155 | 127 | Mauritius | 4.60 | 4.55 | 3.55 | -1 |
| 126 | 128 | Botswana | 4.20 | 4.52 | 2.27 | 7.7 |
| 39 | 129 | Nicaragua | 4.60 | 4.47 | 0.76 | -2.9 |
| 68 | 130 | Gibraltar | 4.55 | 4.38 | 151.96 | -3.8 |
| 158 | 131 | Namibia | 3.92 | 4.06 | 1.93 | 3.7 |
| 41 | 132 | Paraguay | 3.83 | 3.97 | 0.63 | 3.7 |
| 187 | 133 | Cambodia | 4.11 | 3.86 | 0.27 | -6.1 |
| 125 | 134 | Benin | 3.33 | 3.47 | 0.39 | 4.3 |
| 206 | 135 | Nepal | 3.31 | 3.44 | 0.12 | 3.8 |
| 71 | 136 | Iceland | 3.68 | 3.41 | 11.12 | -7.4 |
| 116 | 137 | Palestine | 3.08 | 3.21 | 0.80 | 4.3 |
| 151 | 138 | Madagascar | 2.77 | 3.15 | 0.15 | 13.4 |
| 76 | 139 | Malta | 3.20 | 3.12 | 7.71 | -2.5 |
| 207 | 140 | New Caledonia | 3.04 | 3.04 | 12.23 | 0 |
| 173 | 141 | Togo | 2.70 | 2.85 | 0.44 | 5.6 |
| 161 | 142 | Reunion | 2.82 | 2.82 | 3.68 | 0 |
| 154 | 143 | Mauritania | 2.61 | 2.75 | 0.88 | 5.3 |
| 177 | 144 | Zambia | 2.25 | 2.67 | 0.20 | 18.8 |
| 135 | 145 | Congo, Dem Rep | 2.72 | 2.65 | 0.04 | -2.6 |
| 36 | 146 | Martinique | 2.46 | 2.61 | 6.13 | 6.3 |
| 201 | 147 | Macau | 2.41 | 2.44 | 4.36 | 1.3 |
| 157 | 148 | Mozambique | 2.24 | 2.35 | 0.11 | 4.6 |
| 30 | 149 | Guadeloupe | 2.30 | 2.18 | 4.91 | -5.1 |
| 33 | 150 | Haiti | 2.00 | 2.06 | 0.21 | 2.9 |
| 47 | 151 | Suriname | 1.96 | 2.04 | 4.24 | 4 |
| 190 | 153 | Fiji | 2.06 | 1.93 | 2.22 | -6.2 |
| 175 | 152 | Uganda | 1.99 | 1.93 | 0.06 | -3 |
| 77 | 154 | Montenegro | 1.81 | 1.88 | 2.80 | 4.3 |
| 137 | 155 | Djibouti | 1.70 | 1.76 | 2.43 | 3.4 |
| 192 | 156 | Guam | 1.77 | 1.71 | 9.60 | -3.5 |
| 32 | 157 | Guyana | 1.51 | 1.51 | 2.01 | 0 |
| 127 | 158 | Burkina Faso | 1.40 | 1.43 | 0.09 | 2.1 |
| 166 | 159 | Seychelles | 1.34 | 1.42 | 16.21 | 6.1 |
| 14 | 160 | Barbados | 1.44 | 1.39 | 4.87 | -4 |
| 171 | 161 | Swaziland | 1.18 | 1.38 | 1.03 | 17 |
| 159 | 162 | Niger | 1.29 | 1.34 | 0.09 | 3.5 |
| 145 | 163 | Guinea | 1.35 | 1.33 | 0.13 | -1.2 |
| 152 | 165 | Malawi | 1.26 | 1.31 | 0.09 | 4.6 |
| 167 | 164 | Sierra Leone | 1.24 | 1.31 | 0.26 | 5.9 |
| 200 | 166 | Laos | 1.23 | 1.24 | 0.20 | 1.1 |
| 224 | 167 | Wake Island | 1.28 | 1.23 | NA | -4.3 |
| 28 | 168 | French Guiana | 1.06 | 1.12 | 5.87 | 6.1 |
| 12 | 169 | Aruba | 1.05 | 1.09 | 10.62 | 4.2 |
| 191 | 170 | French Polynesia | 0.99 | 1.07 | 3.73 | 7.7 |
| 15 | 171 | Belize | 0.99 | 0.94 | 3.06 | -5.4 |
| 203 | 172 | Maldives | 0.89 | 0.92 | 2.31 | 3.4 |
| 168 | 173 | Somalia | 0.87 | 0.90 | 0.09 | 3.4 |
| 180 | 174 | Afghanistan | 0.85 | 0.83 | 0.03 | -2.9 |
| 64 | 175 | Faroe Islands | 0.75 | 0.80 | 16.36 | 6.4 |
| 140 | 176 | Eritrea | 0.72 | 0.77 | 0.14 | 6.4 |
| 162 | 178 | Rwanda | 0.74 | 0.74 | 0.07 | 0 |
| 153 | 177 | Mali | 0.70 | 0.74 | 0.06 | 6.4 |
| 2 | 179 | Bermuda | 0.69 | 0.71 | 10.53 | 4.2 |
| 10 | 181 | Antigua and Barbuda | 0.66 | 0.69 | 8.04 | 4.4 |
| 149 | 180 | Liberia | 0.68 | 0.69 | 0.19 | 2.2 |
| 181 | 182 | American Samoa | 0.65 | 0.67 | 10.20 | 2.2 |
| 219 | 183 | Timor-Leste (East Timor) | 0.58 | 0.63 | 0.56 | 8.7 |
| 4 | 184 | Greenland | 0.64 | 0.61 | 10.62 | -4.8 |
| 146 | 185 | Guinea-Bissau | 0.46 | 0.46 | 0.30 | 0 |
| 143 | 186 | Gambia | 0.38 | 0.44 | 0.25 | 15.4 |
| 18 | 187 | Cayman Islands | 0.49 | 0.43 | 8.86 | -11.8 |
| 45 | 188 | Saint Lucia | 0.41 | 0.41 | 2.57 | 0 |
| 128 | 189 | Burundi | 0.35 | 0.37 | 0.04 | 4 |
| 130 | 190 | Cape Verde | 0.32 | 0.34 | 0.68 | 4.5 |
| 184 | 191 | Bhutan | 0.37 | 0.33 | 0.48 | -11.1 |
| 176 | 192 | Western Sahara | 0.32 | 0.32 | 0.67 | 0 |
| 9 | 193 | Antarctica | 0.26 | 0.31 | 17.6 | |
| 29 | 195 | Grenada | 0.28 | 0.30 | 2.78 | 4.8 |
| 44 | 194 | Saint Kitts and Nevis | 0.27 | 0.30 | 6.09 | 11.1 |
| 132 | 199 | Chad | 0.26 | 0.29 | 0.03 | 11.1 |
| 221 | 198 | U.S. Pacific Islands | 0.29 | 0.29 | 1.20 | 0 |
| 215 | 197 | Solomon Islands | 0.23 | 0.29 | 0.54 | 25 |
| 131 | 196 | Central African Republic | 0.34 | 0.29 | 0.06 | -13 |
| 46 | 201 | Saint Vincent/Grenadines | 0.23 | 0.27 | 2.53 | 17.6 |
| 148 | 200 | Lesotho | 0.26 | 0.27 | 0.14 | 5.9 |
| 205 | 202 | Nauru | 0.19 | 0.20 | 21.96 | 9.1 |
| 37 | 210 | Montserrat | 0.09 | 0.15 | 28.73 | 58.7 |
| 213 | 209 | Samoa | 0.18 | 0.15 | 0.77 | -16.7 |
| 53 | 208 | Virgin Islands, British | 0.12 | 0.15 | 6.00 | 25 |
| 222 | 207 | Vanuatu | 0.12 | 0.15 | 0.68 | 25 |
| 164 | 206 | Sao Tome and Principe | 0.13 | 0.15 | 0.86 | 11.1 |
| 133 | 205 | Comoros | 0.12 | 0.15 | 0.20 | 25 |
| 189 | 204 | Cook Islands | 0.09 | 0.15 | 12.71 | 66.7 |
| 220 | 203 | Tonga | 0.20 | 0.15 | 1.28 | -23.1 |
| 23 | 211 | Dominica | 0.13 | 0.14 | 1.93 | 11.1 |
| 6 | 212 | Saint Pierre and Miquelon | 0.09 | 0.11 | 17.78 | 16.7 |
| 49 | 213 | Turks and Caicos Islands | 0.08 | 0.08 | 3.37 | 0 |
| 27 | 214 | Falkland Islands (Islas Malvinas) | 0.05 | 0.05 | 14.57 | 0 |
| 197 | 215 | Kiribati | 0.04 | 0.04 | 0.45 | 0 |
| 209 | 217 | Niue | 0.01 | 0.01 | 2.59 | 2.9 |
| 163 | 216 | Saint Helena | 0.01 | 0.01 | 1.93 | 11.2 |
Download the data
• DATA: download the full spreadsheet, 1980 to 2009, (with ISO codes)
http://www.guardian.co.uk/news/datablog/2011/jan/31/world-carbon-dioxide-emissions-country-data-co2
|
|
|
|
Copyright 2011 Energy and Technical Services Ltd. All Rights Reserved. Energyts.com |